MNet Documents
MNet
MNet: a metabolic network-centered tool for interpreting metabolomic and transcriptomic data
Introduction
MNet features a built-in knowledgebase, dbMNet which is manually curated and provides information on metabolomics, including almost all currently available human metabolic interactions (gene-metabolite and metabolite-metabolite). Grounded in this knowledgebase, MNet offers one subnetwork analyser ( sNETlyser ) and three extended pathway analysers ( ePEAlyser , ePDAlyser , and eSEAlyser ) for user-input metabolomic and transcriptomic data.
Functions
Backend Functions1. sNETlyser
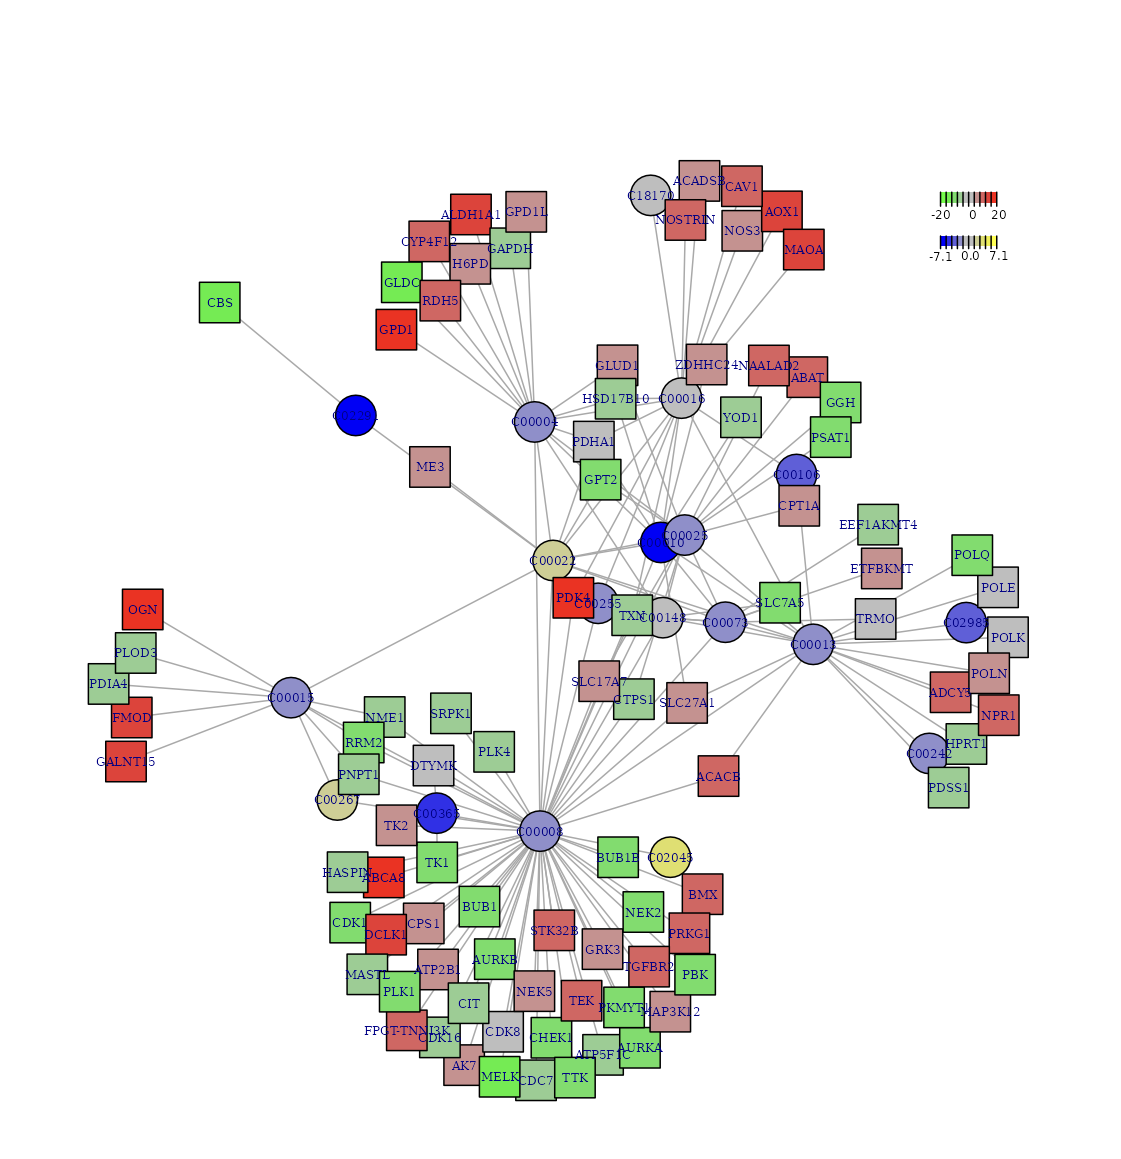
The subnetwork analyser extends the dnet subnetwork algorithm to identify metabolite-gene and metabolite-metabolite subnetwork from metabolomics and transcriptomic data, capitalising our curated dbMNet metabolic network information.
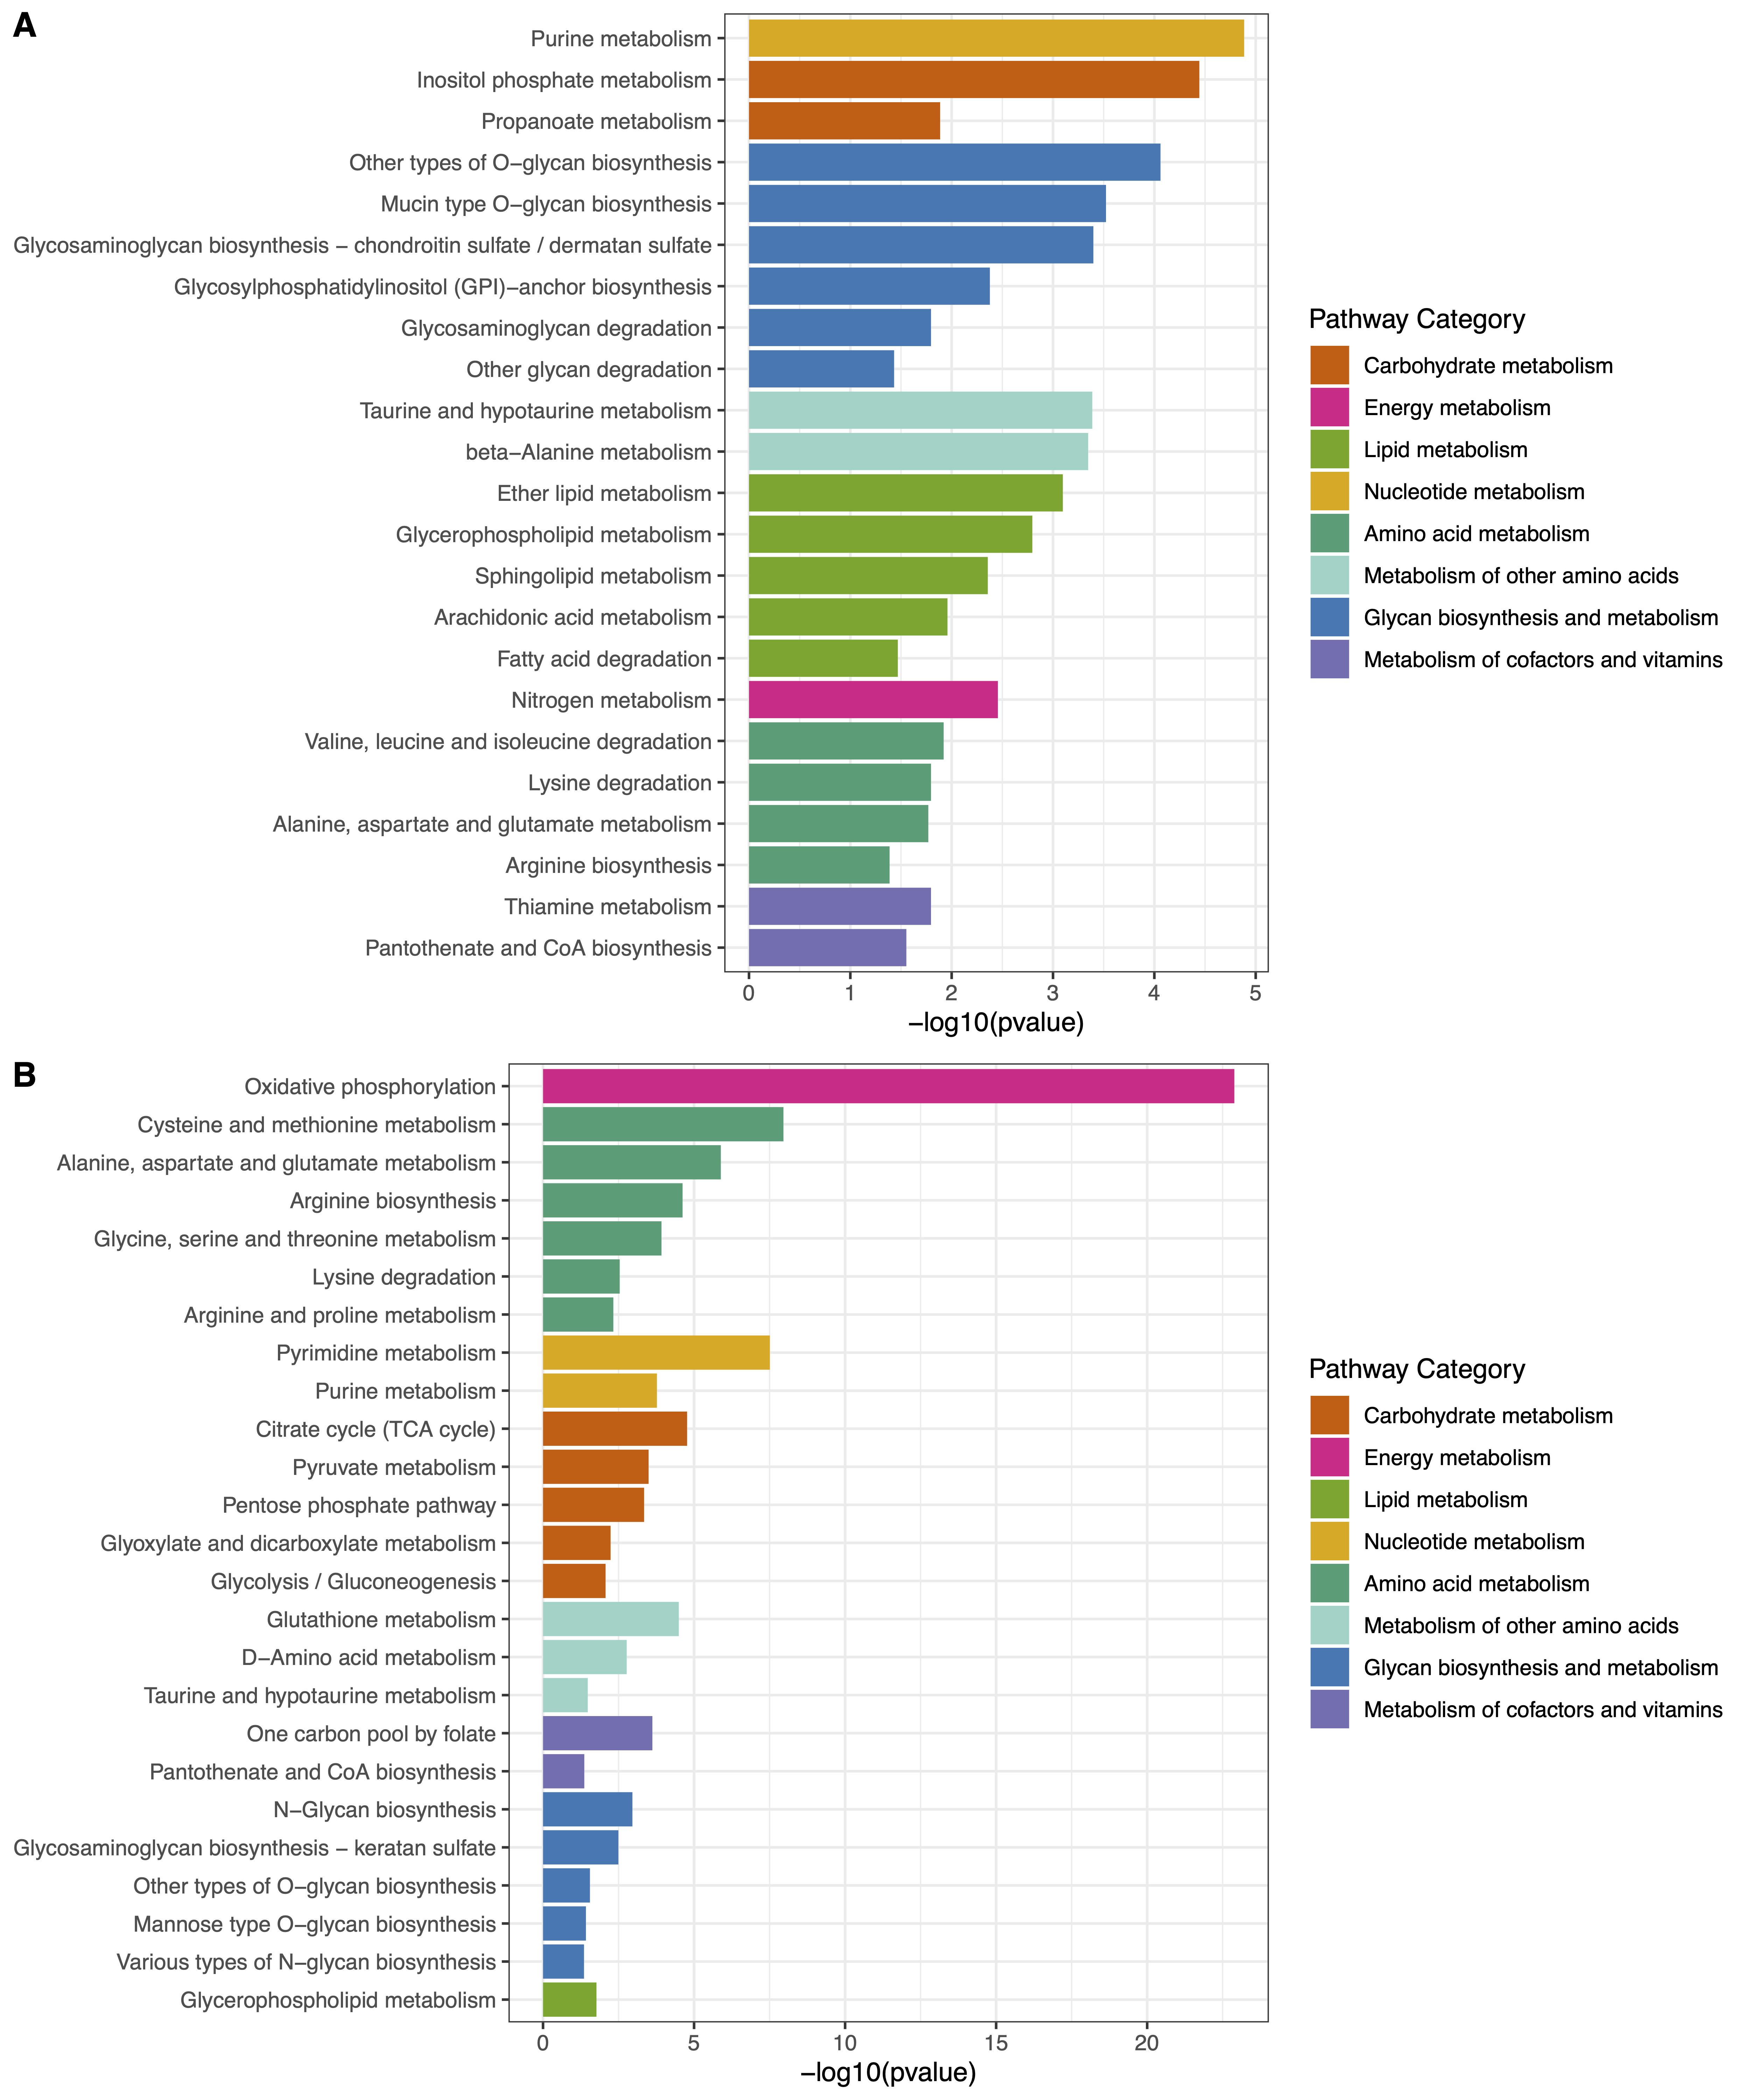
2. ePEAlyser
The extended Pathway Enrichment Analyser. (A) Barplot of cluster1 enriched metabolic pathways corresponding to metabolites and genes. (B) Barplot of cluster2 enriched metabolic pathways corresponding to metabolites and genes.

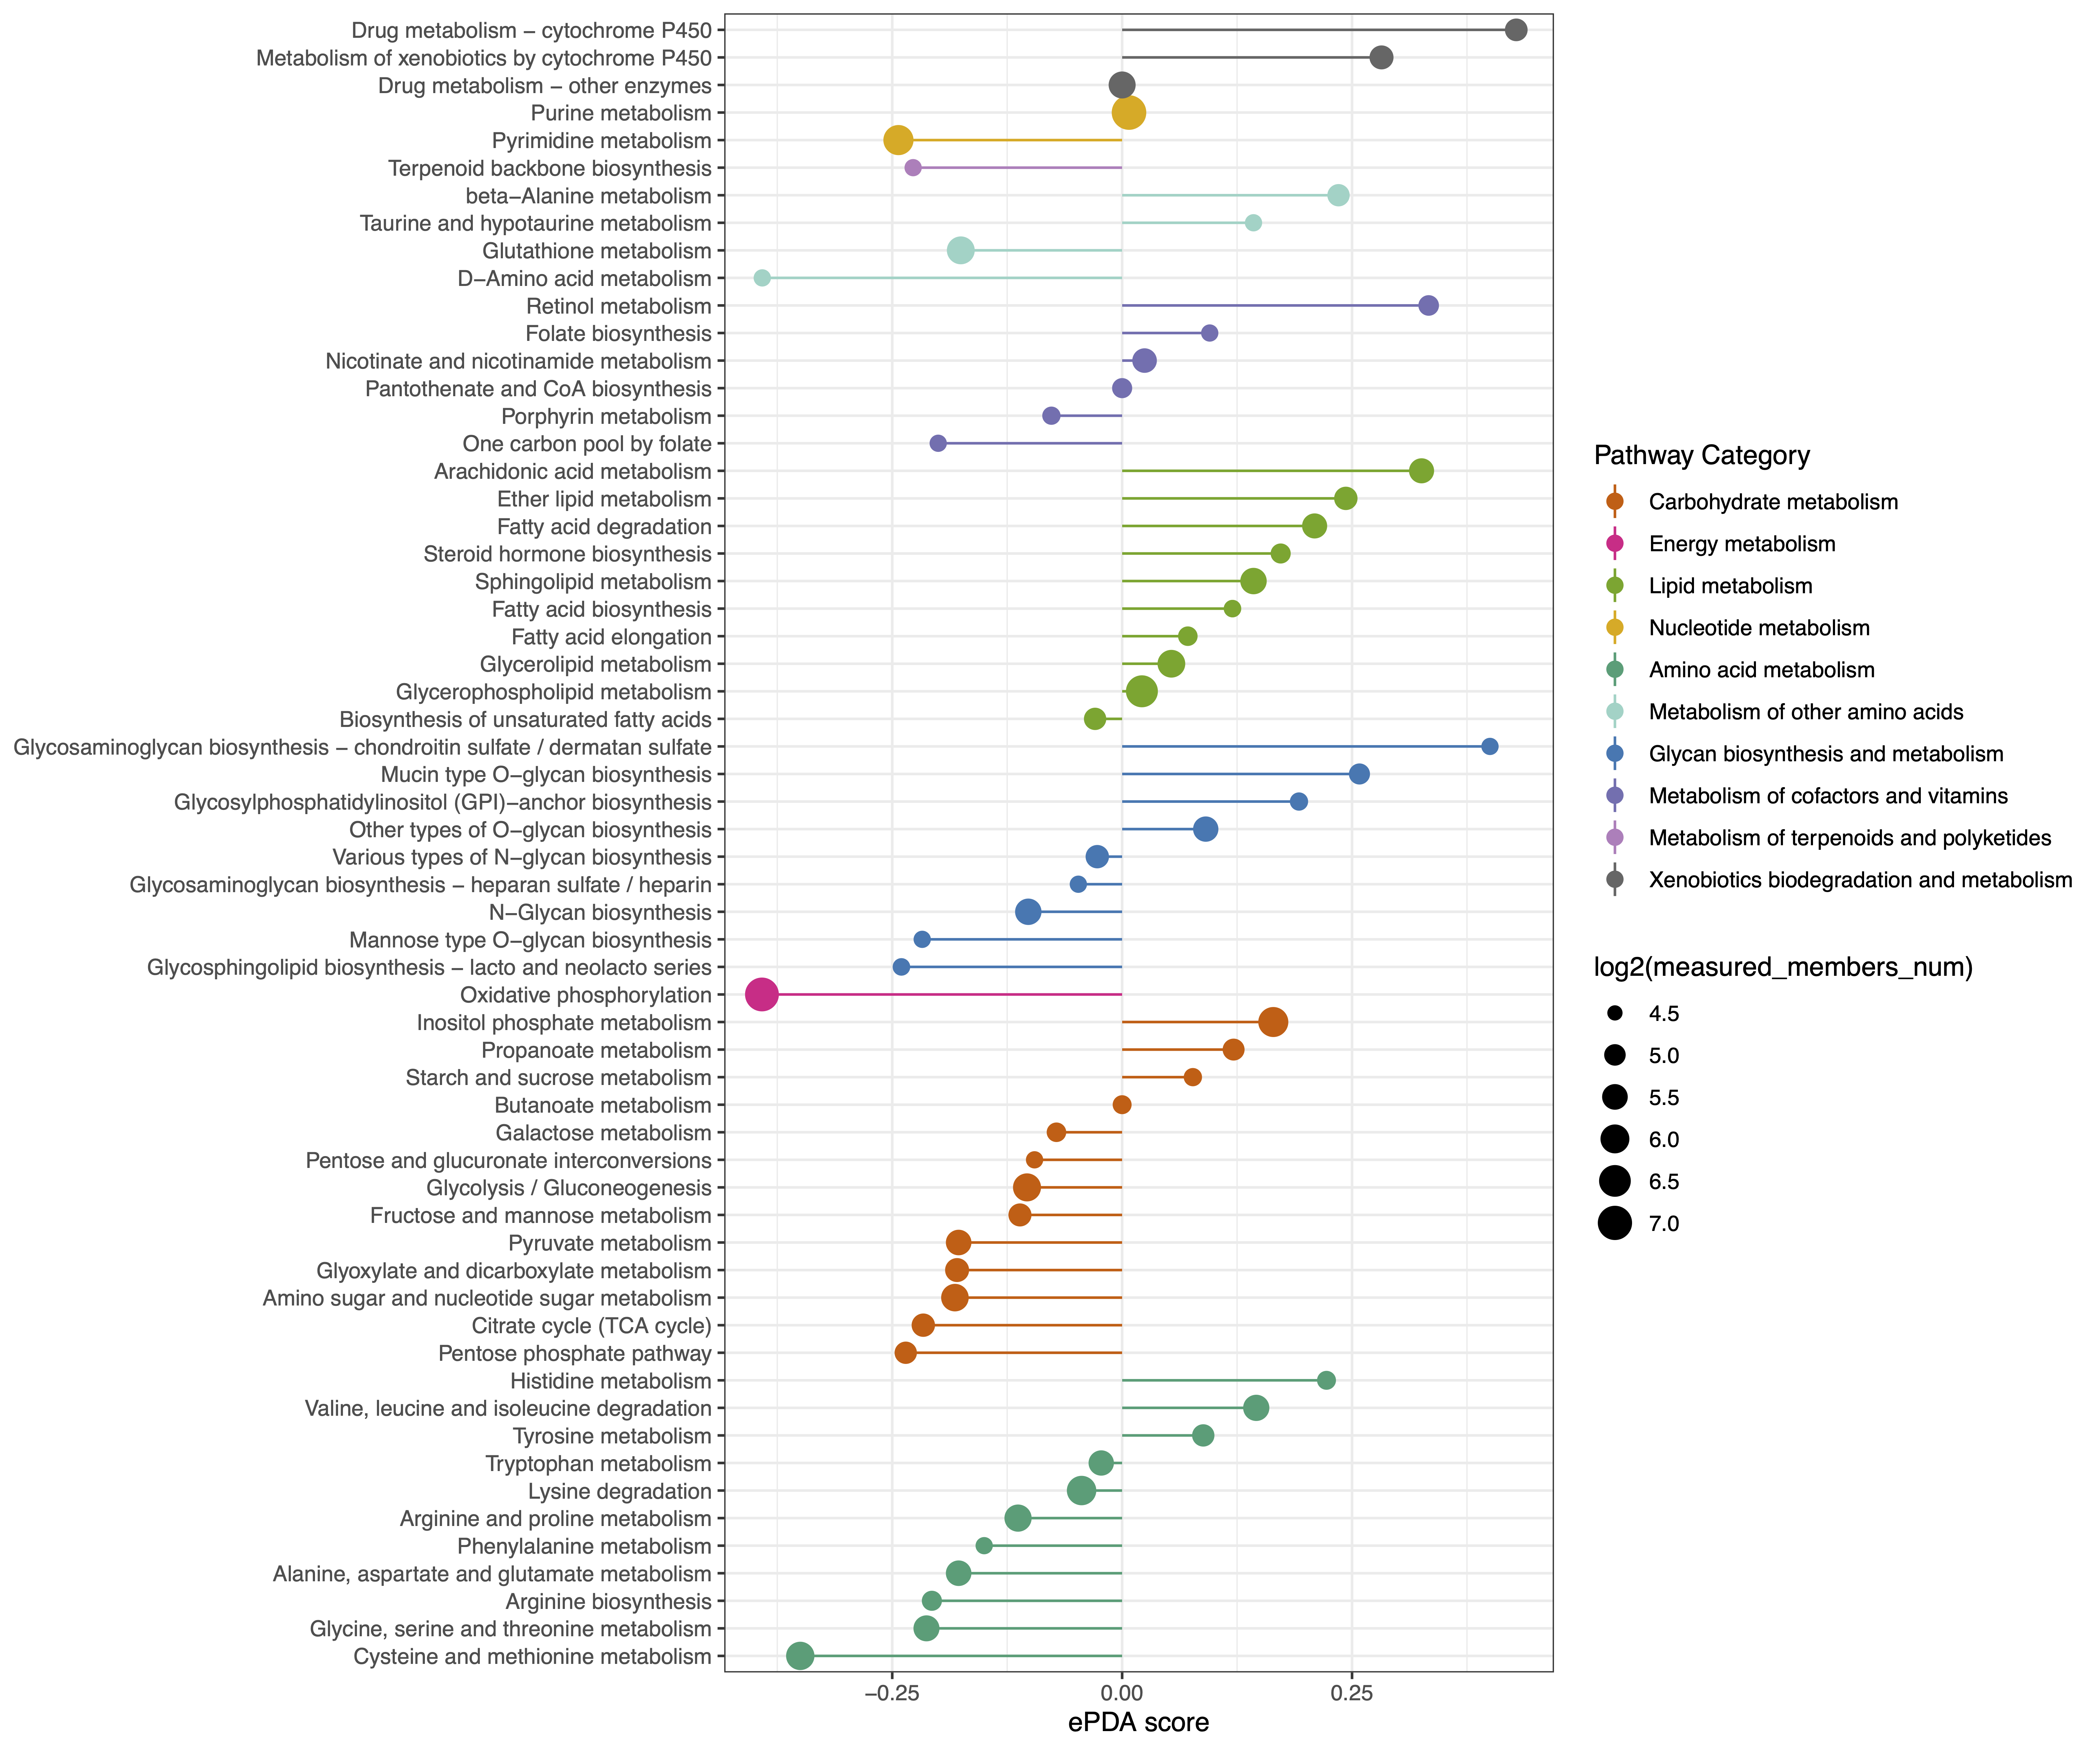
3. ePDAlyser
The extended Pathway Differential Abundance analyser. The ePDA score captures the tendency for a pathway to exhibit increased or decreased levels of genes and metabolites that are statistically significant differences between two groups.

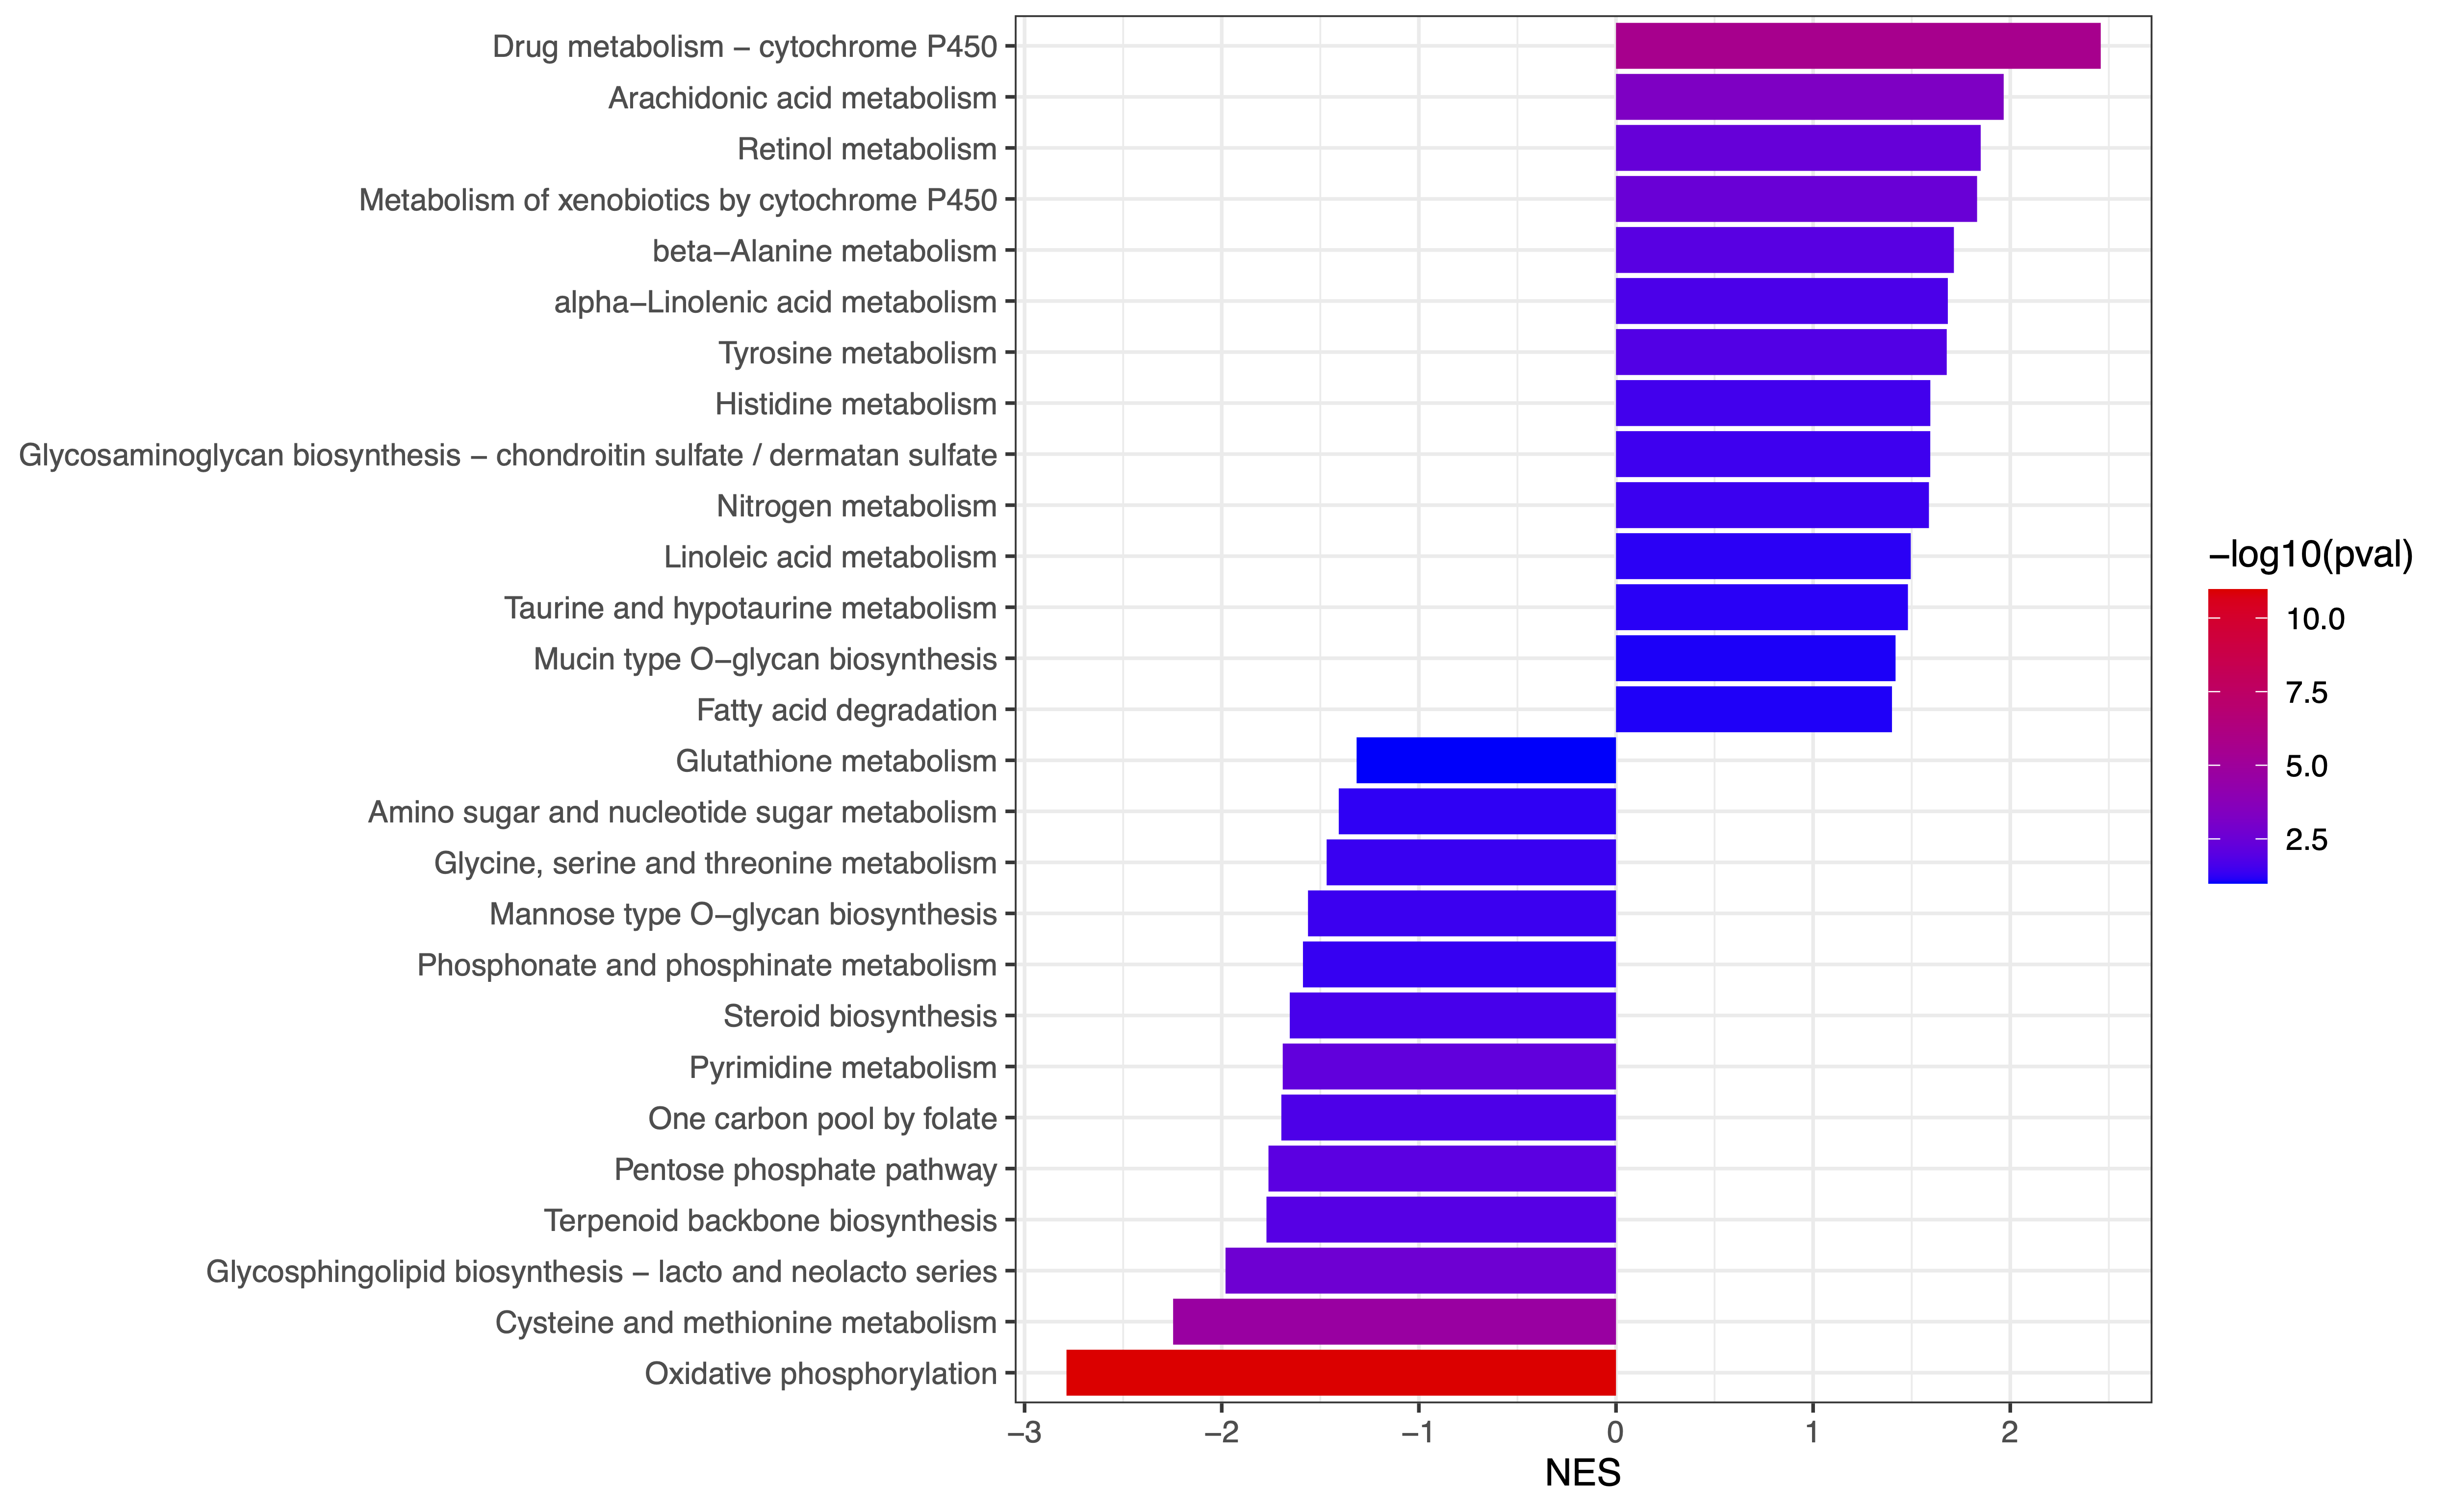
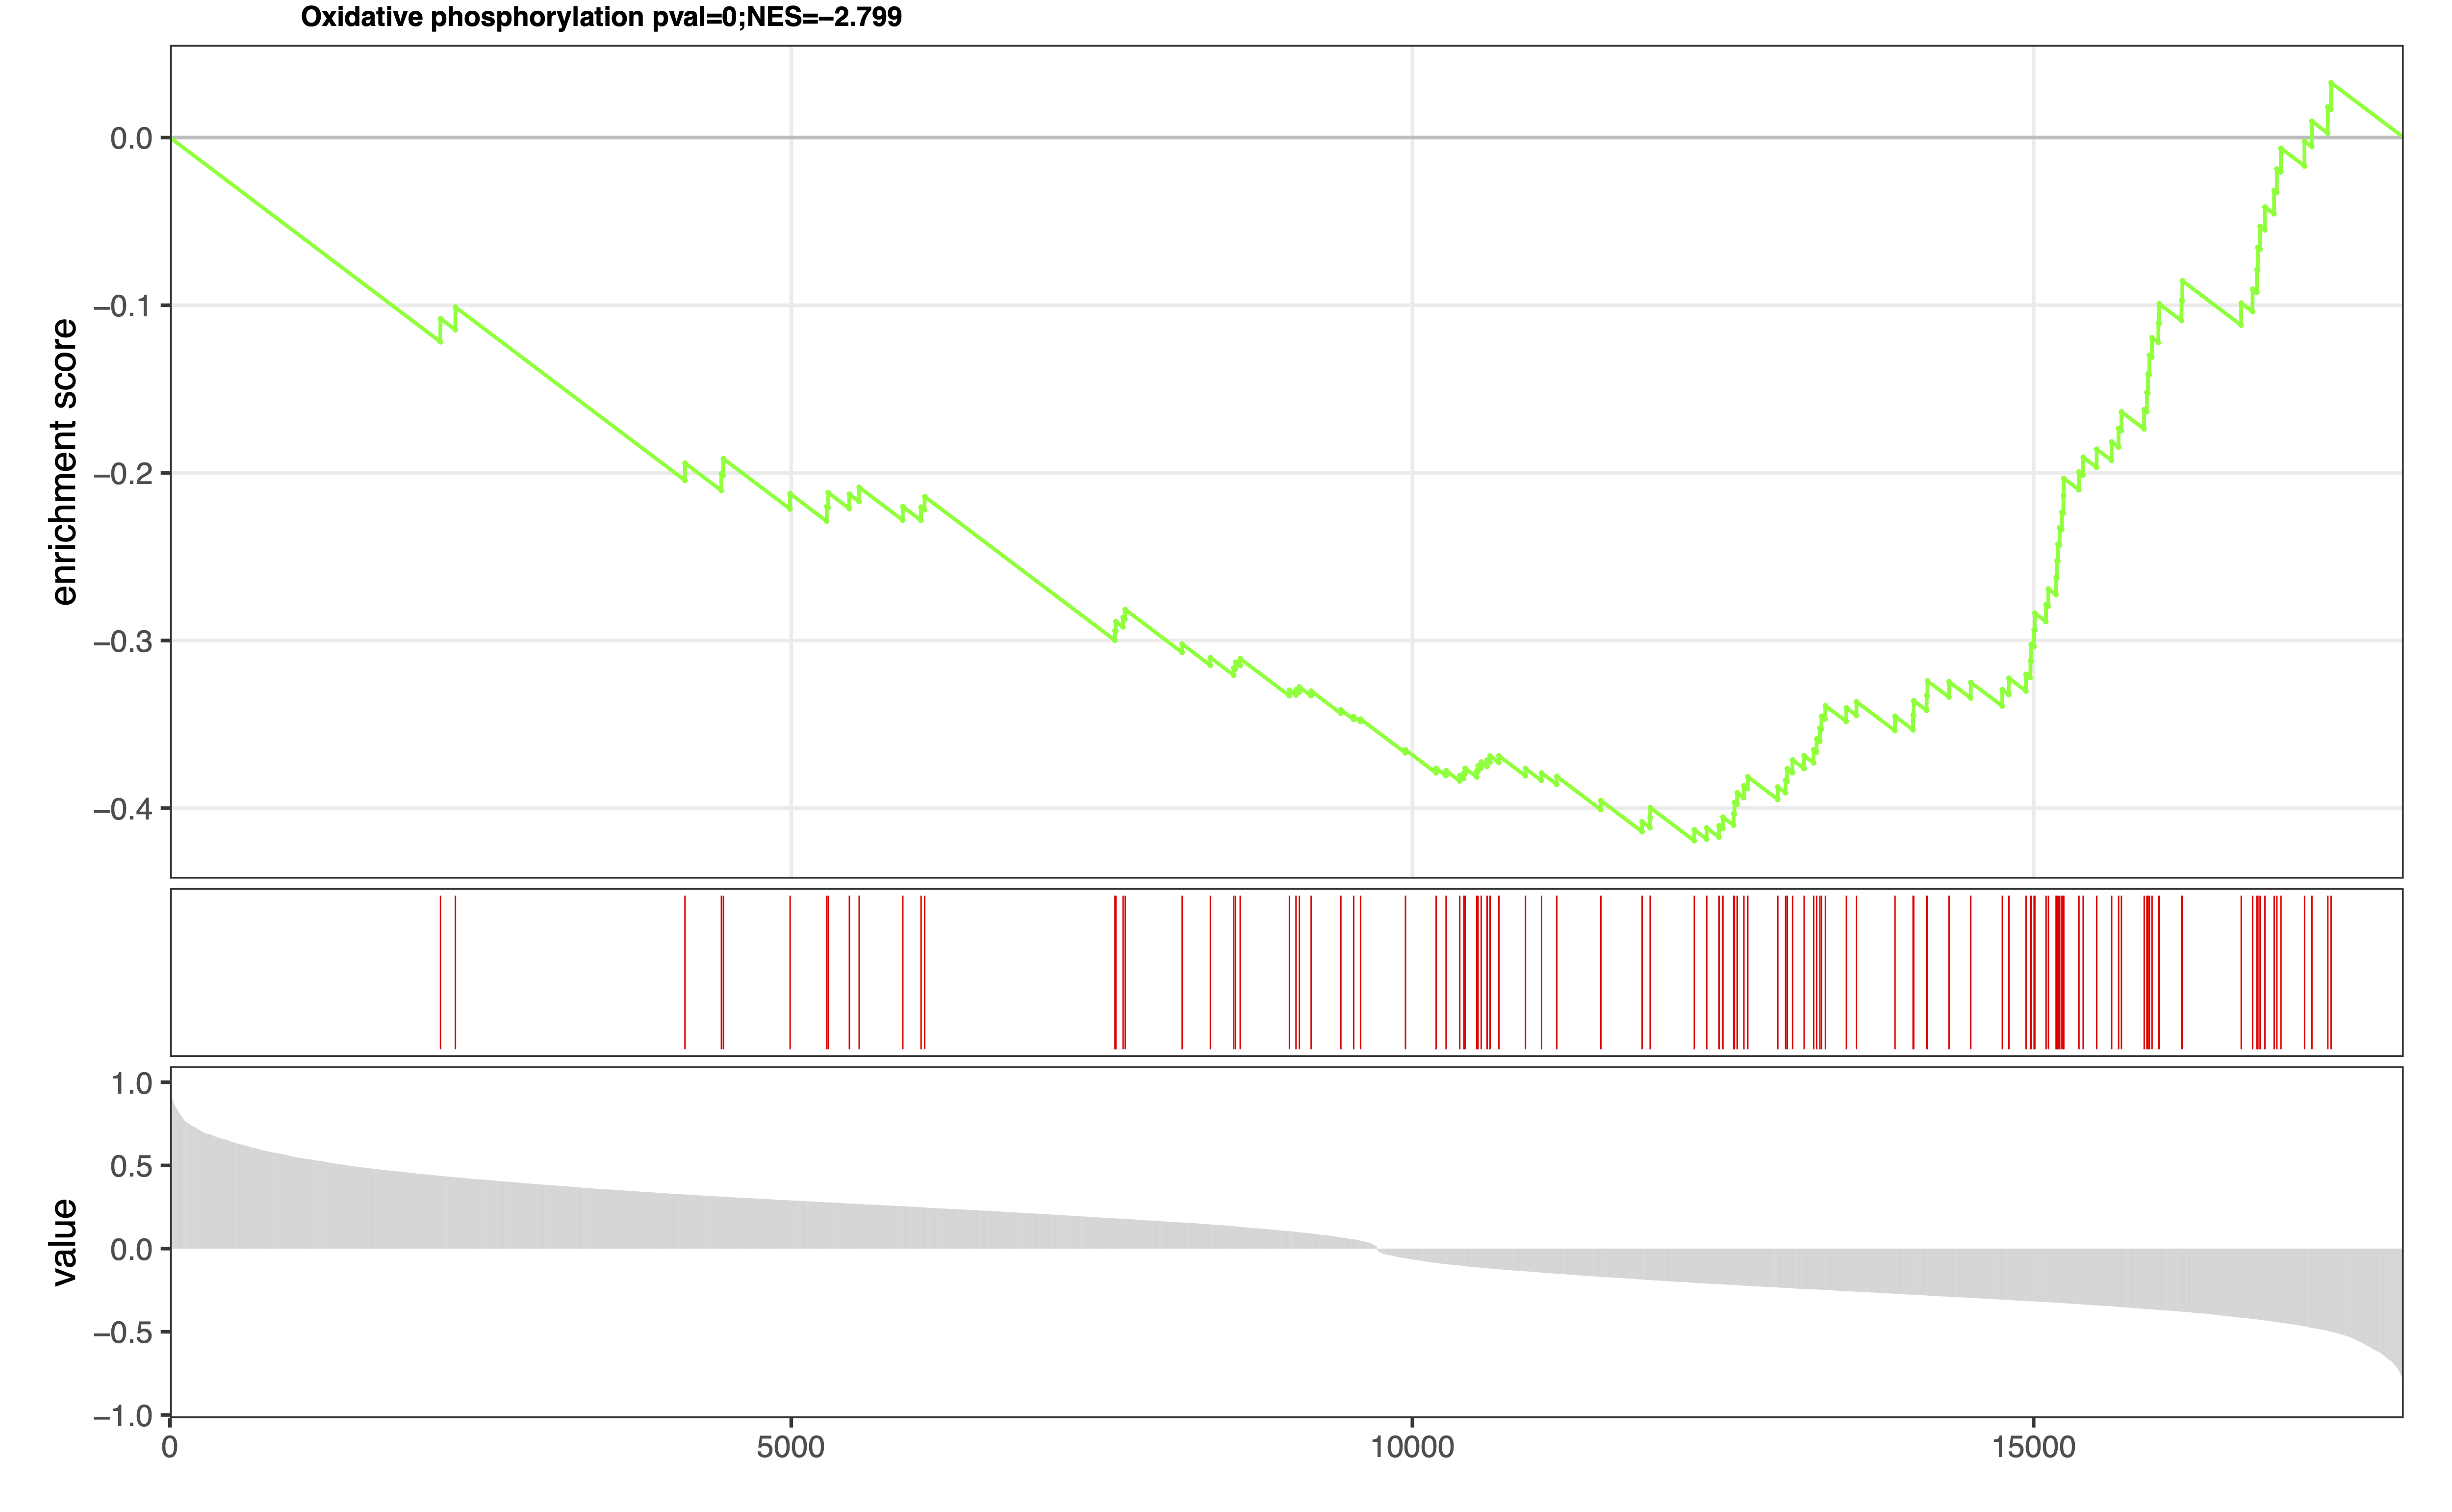
4. eSEAlyser
The extended pathway Set Enrichment Analyser, which aim to identify dysregulated metabolic pathways by considering both metabolites and genes.

Documents
1. MNet Web Server Manual
MNet Web Server Manual2. MNet R Package References
MNet R Package ReferencesKnowledgebase Update and Download
1. Knowledgebase Introduction:
The knowledgebase dbMNet is a freely available knowledgebase that attempts to consolidate information on all known genes and metabolites into a single resource. The knowledgebase includes two knowledgebases, dbNet and dbKEGG.
Knowledgebase dbKEGG, designed for extended pathway analysis sourced from KEGG database, encompasses 1,692 genes and 3,097 metabolites distributed across 84 metabolic pathways and 11 metabolic categories.
Knowledgebase dbNet, designed for metabolism-related subnetwork analysis sourced from KEGG, BiGG, Reactome, SMPDB and WikiPathways, encompasses a total of 54,593 metabolite-gene pairs and 51,719 metabolite-metabolite pairs were documented.
These pairs involve 3,964 genes, and 11,932 metabolites.
The source code for compiling the knowledgebase dbMNet is available here: